Most outbound teams are guessing: campaign analytics is how you stop
Estimated reading time: 10 minutes
McKinsey ran a 2014 survey of about 400 senior managers at large international firms. The intensive users of customer analytics were 23 times more likely to clearly outperform peers on new-customer acquisition, six times more likely on retention, and 19 times more likely to be above-average profitable.
Now look at how most outbound teams answer the question "is the system working?"
They check this week's reply count.
Outbound's whole job is acquiring customers, and it has the thinnest instrumentation of any function that ships revenue. Senders, sequences, message indexes, account-to-rep assignment, infrastructure splits, channel ordering: every one of those decisions either moves the number or doesn't, and most of the time they ship on intuition. The analytics needed to test cleanly don't exist in most stacks.
Fifteen years of experimentation literature has put numbers on what that costs.
The case for instrumentation has been settled in other functions
Brynjolfsson, Hitt and Kim (MIT/Wharton) studied 179 large publicly traded firms in 2011. After controlling for IT spend and traditional inputs, the firms that adopted data-driven decision-making had output and productivity 5 to 6 percent higher than peers. The effect held across asset utilization, return on equity, and market value. Instrumental-variable methods ruled out reverse causality. The work has been cited thousands of times since.
A year later, McAfee and Brynjolfsson published the Harvard Business Review version of the work, surveying 330 public North American companies. Top-tercile data-driven companies were 5 percent more productive and 6 percent more profitable than competitors. Top-tercile is a low bar. Most outbound teams aren't even in the conversation, because the conversation requires instrumentation they don't have.
Germann, Lilien and Rangaswamy (2013, International Journal of Research in Marketing) put a number on the marketing side: a one-unit increase in marketing analytics deployment on a 7-point scale, roughly the move from 50th to 65th percentile, was associated with an 8 percent average increase in ROA, and 21 percent in highly competitive industries with fast-changing customer needs. Outbound qualifies. Deliverability rules shift, buyer fatigue drifts, channel mix turns over, the inbox itself was rewritten by Gmail in 2024. The 21 percent is the relevant number.
Bain's analytics maturity research (over 400 large companies) found the same pattern: companies with advanced analytics were two times more likely to be top-quartile financial performers and five times more likely to make decisions faster. The decision-velocity finding is the one that compounds. In outbound, faster iteration on what's working means more meetings booked per dollar, every quarter.
The literature is consistent. Outbound runs on hunch anyway.
Intuition is wrong most of the time
Ron Kohavi spent over a decade running experimentation at Microsoft, then Airbnb. He, Tang and Xu published Trustworthy Online Controlled Experiments in 2020, drawing on more than 10,000 experiments per year at Microsoft. The headline finding: only about one in three ideas tested at Microsoft improves the metric it was designed to improve. In well-optimized domains like Bing and Google, the success rate is closer to one in ten.
Stefan Thomke documented the same pattern at Booking.com in HBR (March 2020). Booking runs roughly 1,000 concurrent experiments and around 25,000 tests per year. Roughly nine out of ten fail. Booking became the world's largest accommodation platform by instrumenting everything and being willing to be publicly wrong nine times out of ten.
In 2017, Kohavi and Thomke wrote up the Bing headline test that became a textbook example. A small change to the algorithm for displaying ad headlines was sitting deprioritized in the backlog for more than six months because no one believed it would matter. When it finally got tested, it generated about 12 percent revenue lift, roughly $100 million annually. The best revenue idea in Bing's history almost died because senior judgment systematically misranked it.
Kohavi has a line about this that's worth keeping: "We are really, really bad at understanding what is going to work with customers. The less the data, the stronger the opinions." He calls it the HiPPO problem (Highest Paid Person's Opinion), and it's the structural reason data-poor teams over-index on the loudest voice in the room.
Take that finding and apply it to an outbound team without instrumentation. The most senior person on the team has the strongest opinions about what messaging works, the most authority to set sequence length, and the least exposure to per-variant data, because the data doesn't exist. The team is operating exactly the way Kohavi's data scarcity predicts.
The variables that move outbound aren't visible in most stacks
Reply rate is the output. The inputs that produce it are:
- Which sender (mailbox or LinkedIn account) sent the touch
- Which message in the sequence (first email vs. follow-up #2 vs. follow-up #4)
- Which channel (email vs. LinkedIn DM vs. connect-then-DM)
- Which segment the prospect belongs to (industry, company size, role)
- Which infrastructure (which sending domain, which IP pool)
- Which order the channels fired (LinkedIn first vs. email first)
- The time-to-response for each step, which tells you when to follow up next
A standard outbound dashboard surfaces "campaign reply rate." That's it. You can see that Campaign A did better than Campaign B, but you can't see whether Campaign A did better because of the message, because Sender 3 happens to land in inbox more often than Sender 7, because the LinkedIn-first ordering changed the email reception, or because your warmup on a new domain is silently under-delivering.
Gartner's "Future of Sales 2025" research predicted that 60 percent of B2B sales organizations would transition from intuition-based to data-driven selling by 2025. Take Gartner at their word and roughly 40 percent of B2B sales teams are still running on intuition right now. In outbound specifically, where the data is fragmented across email tools, LinkedIn automation, dialers, and CRMs, the share is probably worse.
The honest math on whether you can run a clean test
Most outbound A/B tests are mathematically incapable of catching the wins they're looking for.
Detecting a real effect with statistical confidence requires a minimum sample size per arm. The standard two-proportion test with α=0.05 and power=0.80 gives you the following thresholds at a 5 percent baseline reply rate:
| Lift you want to detect | Sends per arm | Total sends |
|---|---|---|
| 5% → 7% (2pp lift) | ~2,030 | ~4,060 |
| 5% → 6% (1pp lift) | ~8,150 | ~16,300 |
| 5% → 5.5% (0.5pp lift) | ~31,200 | ~62,400 |
Most teams run subject-line and message tests on 200 to 500 sends per variant. At a 5 percent baseline, that powers detection of roughly a 3pp+ effect. Subtle wins, the ones that compound over time, are statistically invisible at that volume. You're catching only the obvious wins.
Larsen et al. published a 2023 review in The American Statistician on this exact problem. Effect sizes in marketing are typically under 1 percent, variance is high, and the sample sizes most teams use are nowhere near what's required for trustworthy single-test conclusions.
The fix is portfolio-level analytics. Pool baselines across many campaigns instead of running each test in isolation. Measure cohort-level metrics so the signal accumulates over time. Accept that some decisions stay directional, but at least you know which ones. None of that is possible without analytics that aggregate cleanly across the campaign portfolio.
Cadence orthodoxy is the case study
The clearest example of an untested assumption in outbound is the standard cadence.
SalesLoft and Outreach both publish best-practice guides recommending 11 to 16 touches over 12 to 22 days, mixing email, phone, and LinkedIn. Neither vendor publishes the underlying methodology in publicly available form. This is industry orthodoxy that has been repeated for a decade without being re-tested against the current inbox.
Belkins ran the largest publicly available re-test in 2025: 16.5 million cold emails analyzed across 93 business domains in 2024. A few details from that data set are worth pausing on:
- A single email achieved an 8.4 percent reply rate, the highest in the dataset.
- Reply rates dropped more than 50 percent by the fifth follow-up.
- Beyond the third follow-up, unsubscribe rates tripled and spam complaints more than tripled.
That contradicts the 12-touch playbook.
The contradiction has teeth because of what changed in the inbox itself. In February 2024, Google and Yahoo rolled out new bulk sender requirements: SPF, DKIM, and DMARC required for senders sending more than 5,000 messages per day to Gmail, one-click List-Unsubscribe headers, and a hard rule that spam complaint rates must stay below 0.30 percent with a target below 0.10 percent. That target translates to one complaint per 1,000 sends. If a campaign hits two "report spam" clicks per 1,000, you're over the safe threshold for that day.
Validity's Sender Score data shows the asymmetry: senders scoring below 91 see at least 20 percent lower inbox placement rates. That damage is invisible in your reply data until reply rates collapse, because Sender Score lives outside your CRM. You can destroy reputation in weeks. Recovery is measured in quarters.
Whether to send the fifth follow-up has become a deliverability decision with real cost. Without analytics that surface complaint rate by sender and by message index, you can't make it.
What a campaign analytics layer has to measure
If outbound decisions need to be defensible, the spec is concrete.
| Most outbound dashboards show | What you actually need |
|---|---|
| Campaign-level reply rate | Reply rate per sender, per domain, per message index, per channel, per segment |
| Sequence completion rate | Per-step funnels with drop-off visible at every touch |
| Aggregate channel attribution | Channel ordering effects (LinkedIn-then-email vs. email-then-LinkedIn) |
| Email open rate (mostly noise post-MPP) | Time-to-response medians by channel, which actually drive cadence design |
| "Who replied" list | Raw row-level access across every prospect and every variable |
| Single-campaign A/B results | Cross-campaign aggregation so single tests aren't the unit of analysis |
The last row matters most. The Larsen et al. critique is that single tests are statistically weak. The fix is portfolio-level metrics: hundreds of small experiments, pooled, where the signal compounds across campaigns. That's what experimentation platforms do at Microsoft and Booking.com. Outbound should run the same way.
How we built ours
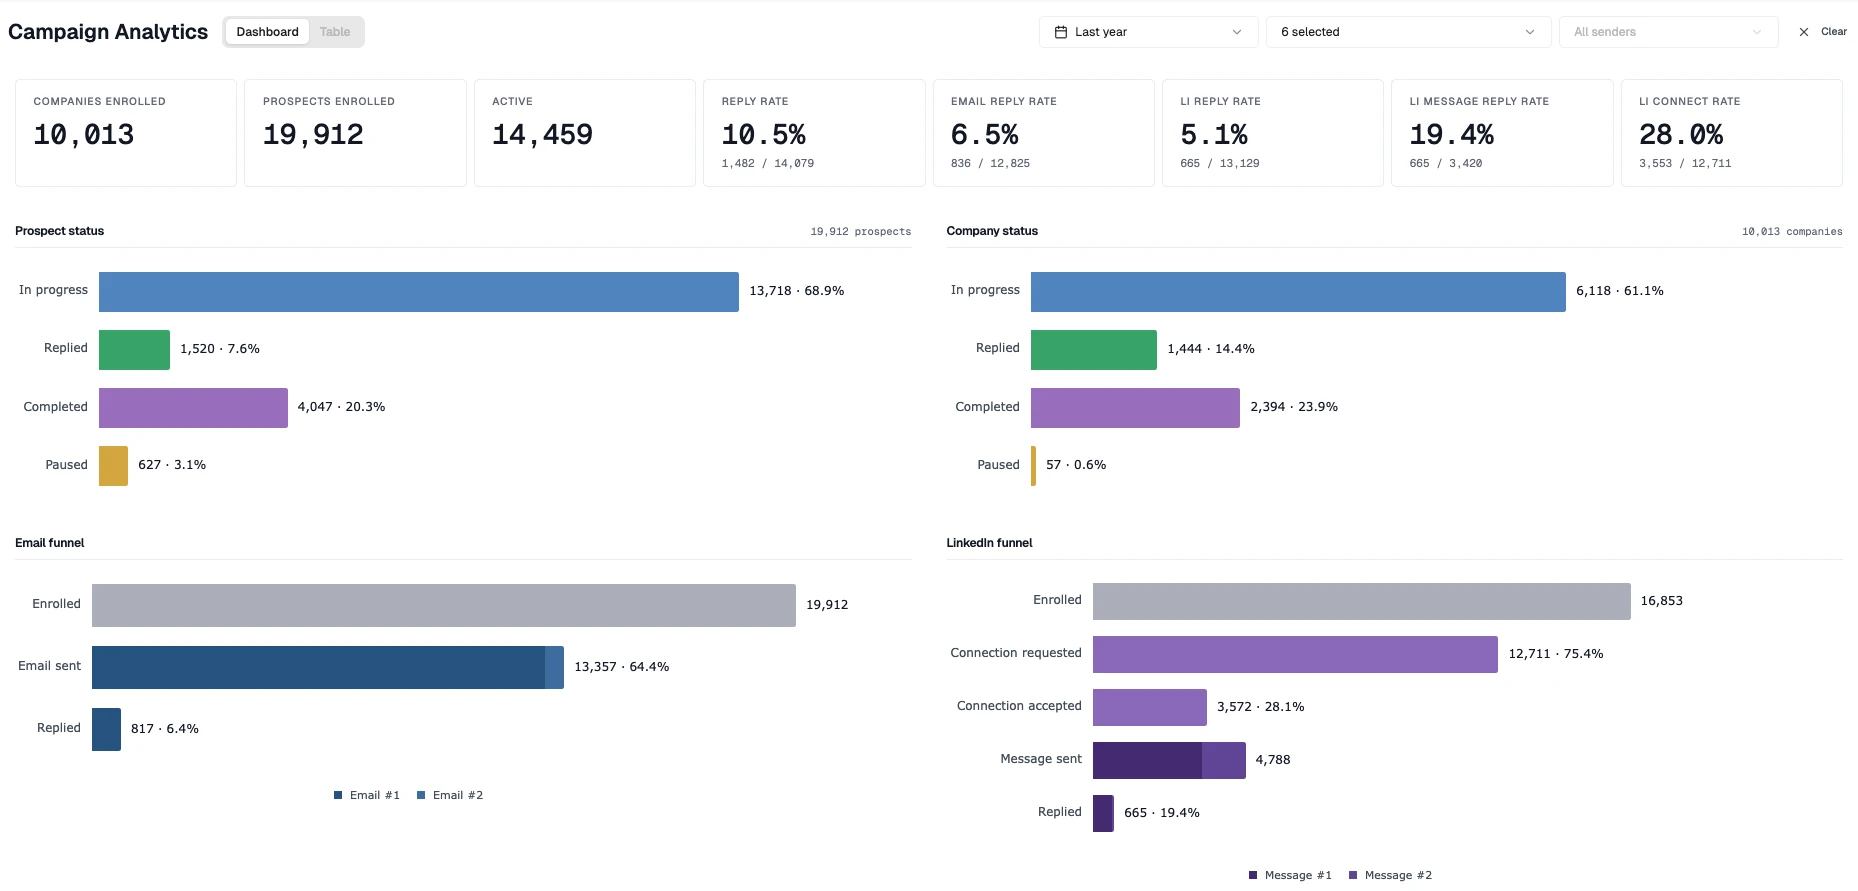
This is the system we wanted to use, so we built it. The Campaign Analytics panel inside Emitree exposes per-sender, per-step, per-channel, per-segment performance and a raw 34-column row-level view across every prospect.
Our own automated outbound numbers: 6.5 percent email reply rate, 5.1 percent LinkedIn reply rate, 19.4 percent reply rate on LinkedIn messages sent, 28.0 percent LinkedIn connect acceptance.
For context, Instantly's 2026 benchmark report, drawn from billions of cold email interactions across their platform, puts the average cold email reply rate at 3.43 percent. Our 6.5 percent is roughly twice that. Across LinkedIn and email combined, our reply rates land in line with what a good BDR puts up by hand, which is the bar that matters when the alternative is paying someone to do this work full-time. What the stack actually buys, beyond the headline number, is the ability to attribute the lift to specific senders, message indices, and segments instead of guessing.
What instrumentation actually buys
The real payoff shows up after about twelve months of clean ground truth.
I learned this at Assurance. We ran live dashboards across every variable that touched the outbound and inbound funnel: marketing mix, dial counts, connect rates, call outcomes, policies sold, line by line, updating in real time. Visibility was a first-class requirement. We ran experiment after experiment until we found recipes that consistently worked. Then we handed the clean data to Data Science and they built predictive models on top of it. Watching that compound, from intuition to disciplined experimentation to ML-driven optimization, is where I learned to take this seriously.
That progression doesn't work in reverse. You can't bolt predictive scoring on top of a system that doesn't measure cleanly. The data quality determines the ceiling on everything that gets built later.
B2B outbound hasn't been instrumented the way the rest of the funnel has. Teams that close that gap will look, twelve months out, like the customer-analytics leaders in McKinsey's 2014 survey: several multiples better at acquisition. The compounding effect has been documented for a decade.
Sources
- Brynjolfsson, Hitt & Kim — Strength in Numbers: How Does Data-Driven Decisionmaking Affect Firm Performance? (SSRN, 2011): peer-reviewed evidence that DDD lifts productivity 5 to 6 percent, n=179.
- McAfee & Brynjolfsson — Big Data: The Management Revolution (HBR, 2012): top-tercile data-driven companies are 5 percent more productive, 6 percent more profitable, n=330.
- McKinsey — Five facts: How customer analytics boosts corporate performance (2014): 23x acquisition, 6x retention, 19x profitability multiples for analytics-intensive users.
- Germann, Lilien & Rangaswamy — Performance implications of deploying marketing analytics (IJRM, 2013): 8 percent ROA lift, 21 percent in fast-changing markets, n=212 Fortune 1000 firms.
- Kohavi, Tang & Xu — Trustworthy Online Controlled Experiments (Cambridge, 2020): only 1 in 3 ideas at Microsoft, 1 in 10 at Bing/Google, improve the target metric.
- Thomke — Building a Culture of Experimentation (HBR, 2020): Booking.com runs ~25,000 tests/year; ~9 of 10 fail.
- Kohavi & Thomke — The Surprising Power of Online Experiments (HBR, 2017): Bing headline test sat in backlog for 6+ months, generated ~$100M when finally tested.
- Larsen et al. — Statistical Challenges in Online Controlled Experiments (American Statistician, 2023): review of why marketing A/B tests are chronically underpowered.
- Bain — The Value of Big Data (How Analytics Differentiates Winners): 2x top-quartile financial performance, 5x faster decisions, n>400.
- Belkins — Cold Email Response Rates 2025 Study (16.5M cold emails): follow-up drop-off curves, complaint and unsubscribe escalation past touch #3.
- Instantly — Cold Email Benchmark Report 2026: platform-wide average cold email reply rate of 3.43 percent across billions of interactions.
- Google — Email Sender Guidelines (bulk sender requirements, Feb 2024): SPF/DKIM/DMARC requirements, 0.30 percent complaint rate ceiling, 0.10 percent target.
- Validity — Sender Score: a credit score for IP address reputation: sub-91 sender scores see 20 percent+ inbox placement loss.
- Gartner — Future of Sales 2025 (press release, Oct 2020): 60 percent of B2B sales orgs to be data-driven by 2025.